💹 Stock Analysis
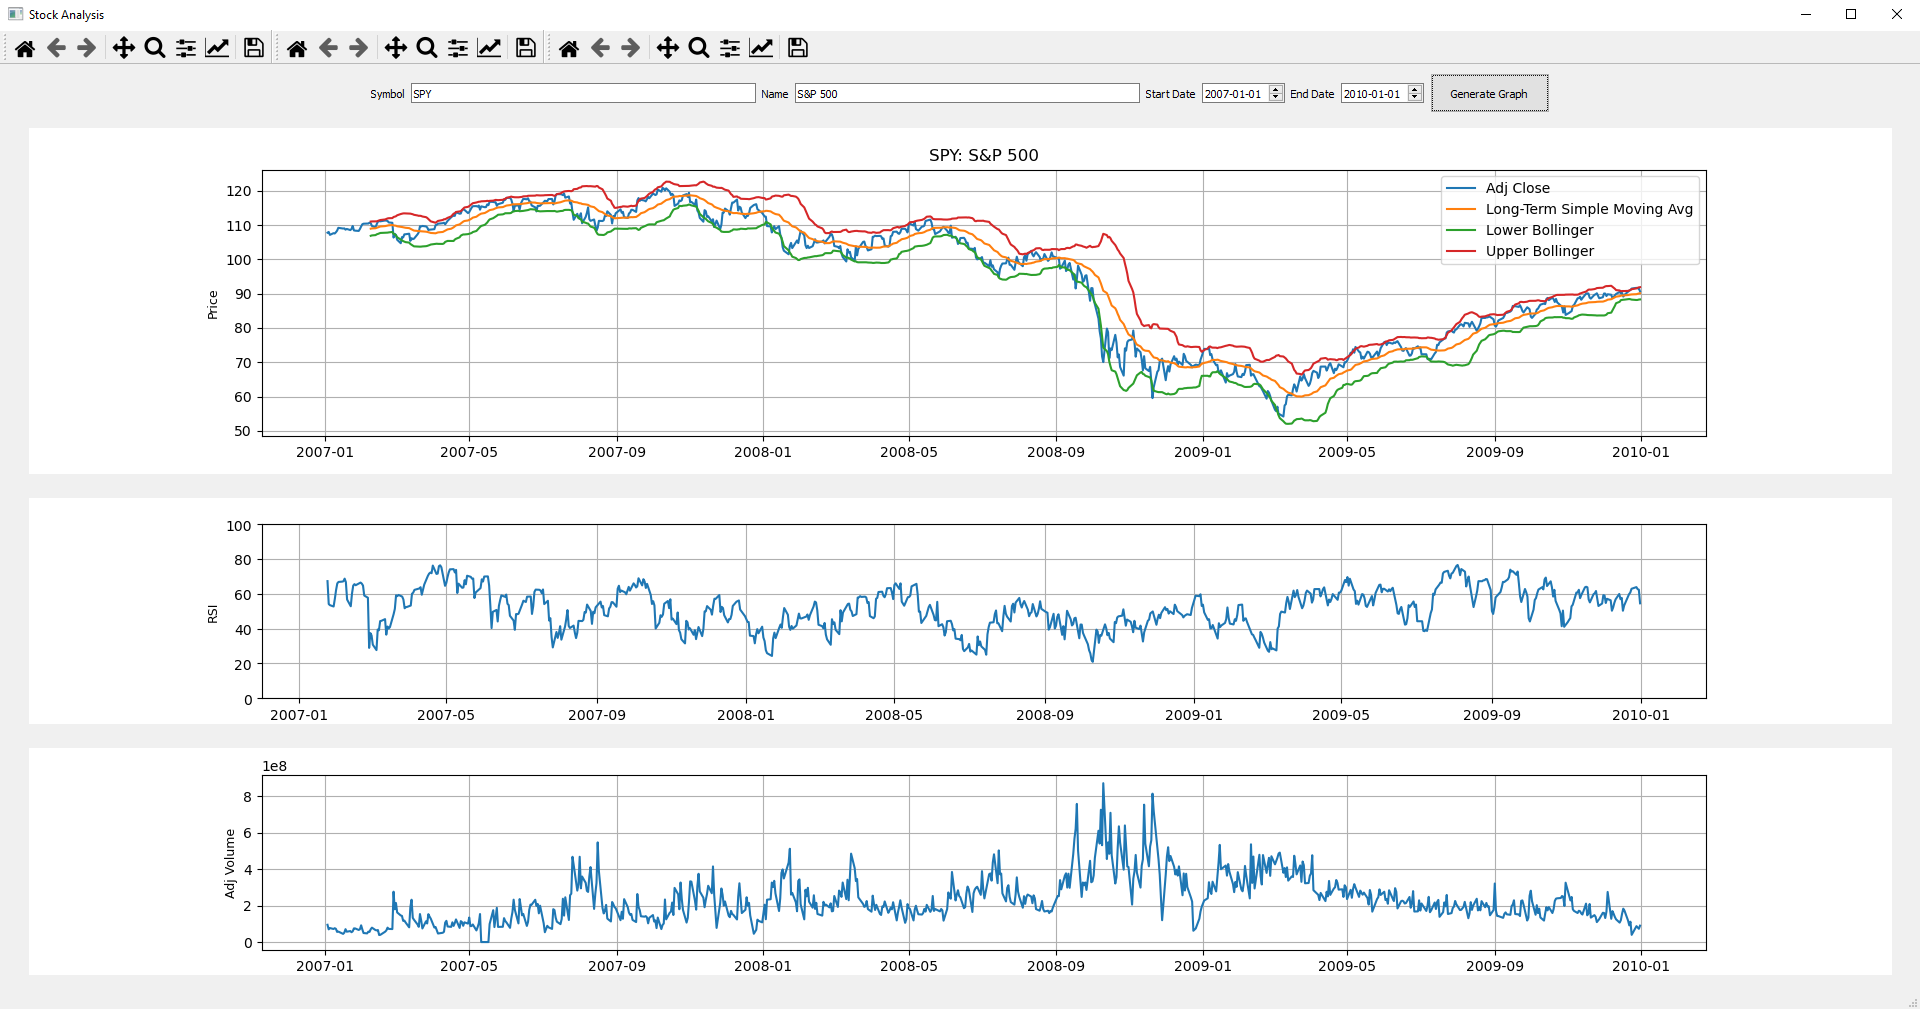
Calculates and visualizes technical indicators with Pandas/NumPy including: moving averages, standard deviations, Bollinger bands, and RSI.
Python, Pandas, Matplotlib
Calculates and visualizes technical indicators with Pandas/NumPy including: moving averages, standard deviations, Bollinger bands, and RSI.
Python, Pandas, Matplotlib
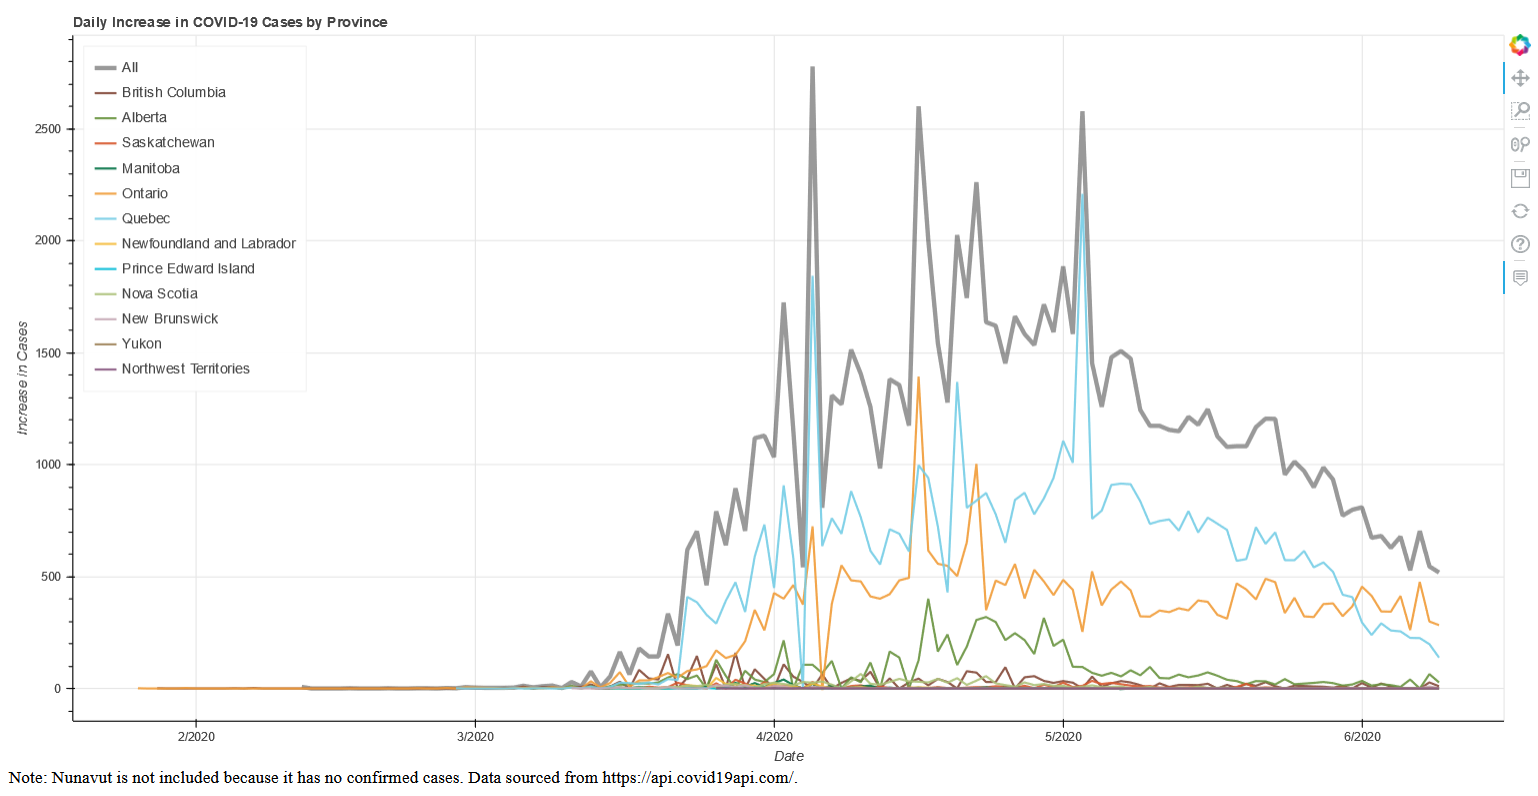
Interactive Bokeh/Flask dashboard to visualize Canadian pandemic data by province. Calculates daily increase in COVID-19 cases by parsing JSON API data.
Python, Flask, Heroku
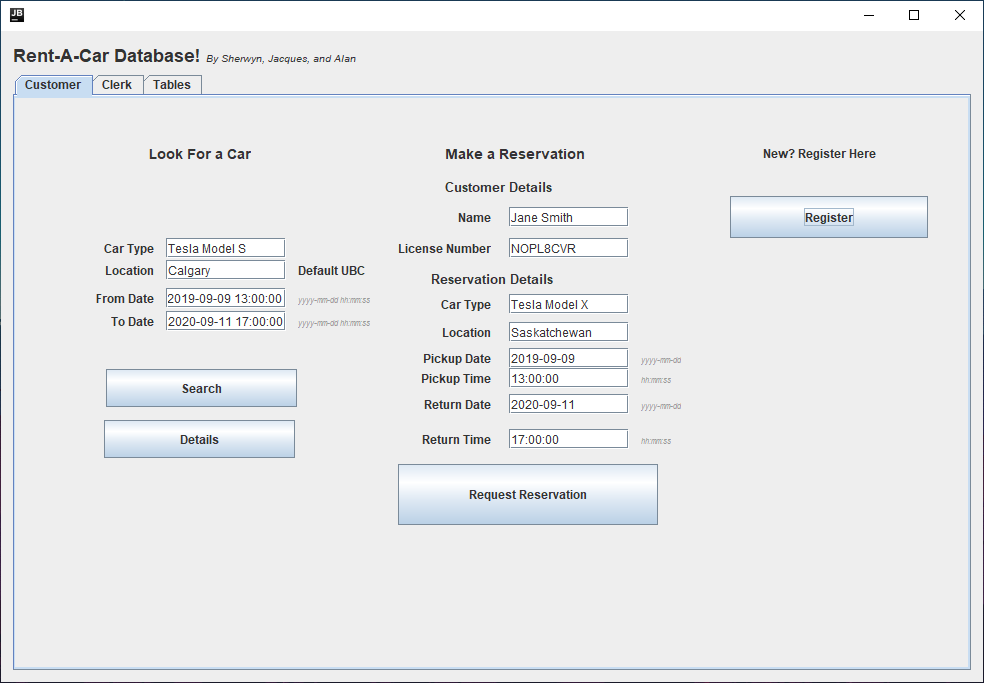
Designed, normalized, and created a relational DB using Oracle SQL, Java Database Connectivity (JDBC), and Swing. Aggregates company/branch-wide information, and allows clients to register, search available rentals, and calculate estimated cost.
Java, SQL